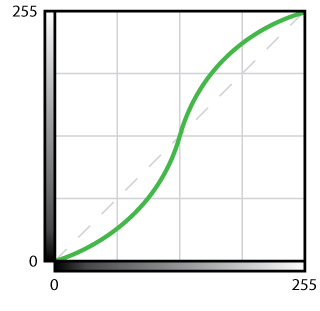
One of the most well known operations that people perform on histograms is the S-curve. Typically, the S-curve is used to increase the contrast of some portions of a photograph, at the cost of reducing the contrast in other areas of the photograph.
All of the example remapping functions in section 4 used straight lines. However, one is not only limited to using straight lines in the curves filter. In fact, it is much more common to use a curved line for the remapping function.

Figure 1 shows the basic shape of the S-curve. The basic idea is that darker pixel values are made a bit darker, while lighter pixel values are made a bit lighter. The magnitude of the value change will depend on how drastic the S-curve is (more drastic, more change). If you have read through the previous section of this article, you should hopefully have a fairly good idea of what the s-curve is doing to the histogram. The diagonal dotted line represents a "do nothing" remapping function and will be referred to as the identity line. There are three pixel values where the S-curve meets with the identity line: 0 (far left), 127 (half-way point), and 255 (far right). For these three input pixel values, the output pixel values will remain the same. For the lower half of the input range, the S-curve is below the identity line, meaning that these pixels will become darker. For any given input pixel value, the further the S-curve line (green line) is from the identity line (grey dotted line), the more that pixel value will be darkened. The same is true for the upper half of the input pixel values, except that the pixels we be made lighter instead of darker.

Figure 2 shows how the S-curve affects the pixel values as the input is mapped to the output. The center region is marked with a blue tint. This is the area where the s-curve is moving more vertically than it is moving horizontally. The result is that the given range of inputs is mapped to a larger range of outputs. That is, contrast is being added to the areas of the photograph that contain pixels in this region of the histogram. There are also to red tinted regions on either side of the blue tinted region. In these regions, a given range of inputs are mapped to a smaller range of outputs. That is, contrast is being removed from the areas of the photograph that correspond to these pixels.
There is no reason that the S-curve needs to be centered within the chart in the Photoshop curves filter. In fact, it will probably be the case that you do not want to center the S-curve in the chart, but rather center it near the area in the histogram where the majority of your pixels are located. Depending on the effect that you are going for, this might not be the case either. At the end of the day, you want to place the more vertical region of the S-curve in the area of the histogram where you'd like to add more contrast. Keep in mind that there is also no reason that you cannot have multiple S-curves in the same Photoshop curves filter (i.e. the remapping function is shaped so that it would have multiple blue regions).